
India’s population changes: from baby boom to fertility challenges. india news

“Whatever you can say that is true about India, the opposite is also true.” The old Joan Robinson line still works because India have a way of defeating neat summaries. Most national averages come with broad patterns, outliers, and caveats.The latest sample registration system data is one such mirror. The SRS, India’s official large-scale system for tracking births and deaths, gives annual estimates of fertility and mortality. At first glance, the headline number is simple: India’s fertility has fallen below replacement level. But a closer look reveals a more unequal country. Some parts of India are already in the low fertility zone. Some of it is still above replacement. Cities are reducing fertility on a large scale, but urban Bihar is not following this scenario. Higher-order families are having fewer children, but the social consequences of smaller families are just beginning. Fewer infants are dying, but the first weeks of life remain a danger zone. And while births are now much more frequent within the hospital system, deaths are not.For years, the policy conversation moved between two extremes, fear of too many births and celebration of a young workforce. A youth population can become a dividend only if it is properly trained and empowered. Meanwhile, populations with low fertility bring their own demands, such as pensions, care for the elderly, chronic disease treatment and migration plans. Both have their own challenges.We look at five data points from the SRS data that shed light on various such issues.
averageness hides anxiety
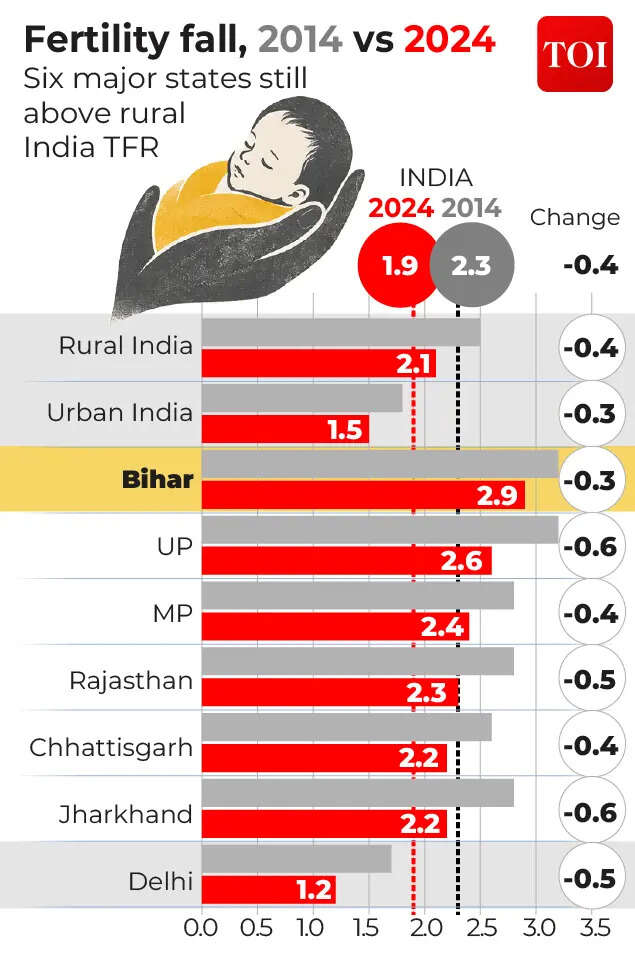
India’s total fertility rate, or TFR, is now 1.9. TFR means the average number of children a woman is expected to have in her lifetime, based on current fertility rates. India’s TFR in 2014 was 2.3. Rural India has come down from 2.5 to 2.1. Urban India has gone from 1.8 to 1.5. In demographic language, India is below replacement fertility. To put it plainly, the baby boom is over.But the national average is just the beginning. Bihar is still at 2.9. Uttar Pradesh is at 2.6. Madhya Pradesh is at 2.4. Rajasthan is at 2.3. Chhattisgarh and Jharkhand are at 2.2. Delhi, a city-state, sits at the other end of the spectrum at 1.2. The World Bank has warned that South Asia is not creating enough jobs for its working-age population, especially youth and women. When above-replacement fertility is concentrated in a few poor states of India, the policy challenge is obvious.
Bihar exception
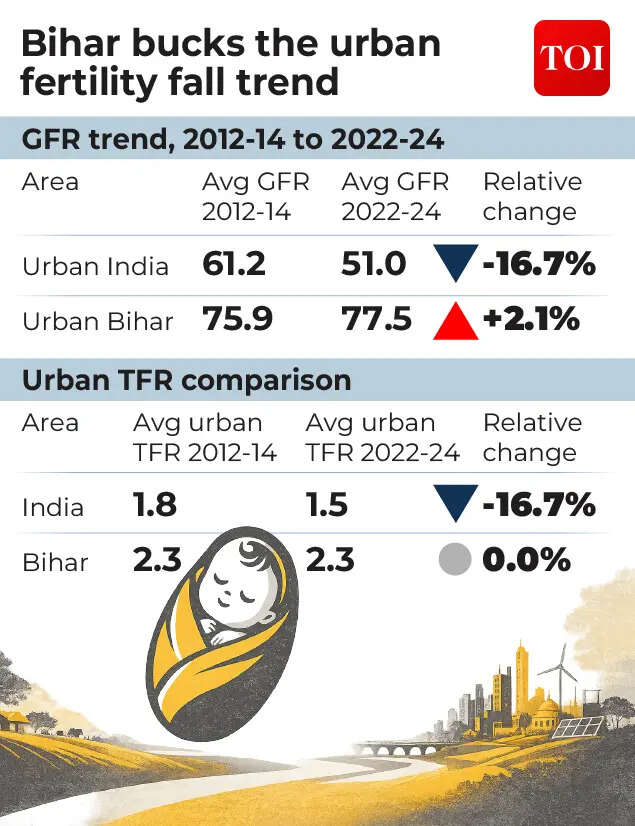
The second data comes from urban India, where a different story emerges. The common belief is that once people move to cities, families become smaller because parents want to invest more in fewer children. Across India, this overarching story persists. Urban India’s average general fertility rate, or GFR, fell from 61.2 births per 1,000 women aged 15-49 in 2012-14 to 51.0 in 2022-24. GFR measures the number of live births in a year per 1,000 women in the reproductive age group of 15–49 years. Here, live births means children born alive, which is the basis used to calculate fertility and mortality rates.But Bihar has broken this pattern. During the same period, the average GFR of urban Bihar increased from 75.9 to 77.5. One year’s data makes the difference even more stark. In 2024, the GFR of urban Bihar was 80.3, while that of urban India was 49.8.
birth ladder is getting thinner
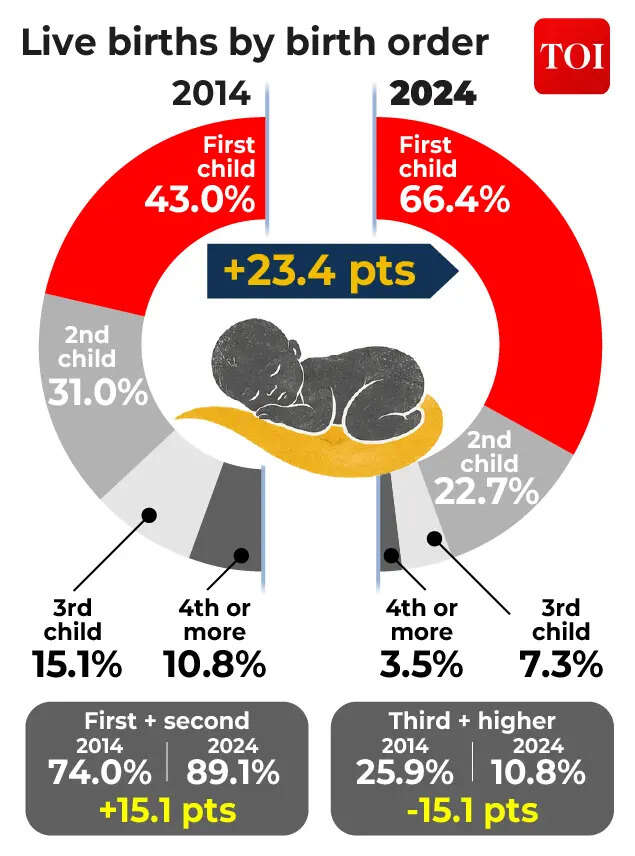
The third innings is less surprising, yet perhaps the most important. In 2014, 43% of live births in India were first-born children. By 2024, their number will rise to 66.4%. Third and higher order births fell from 25.9% to 10.8%. The fourth or higher birth rate fell from 10.8% to 3.5%.This does not mean that every family is stopping at one or two children. This means that the births that are taking place now are similar to the first and second births. The old ladder, third child, fourth child, fifth child, is getting thin. This is a much bigger social change than it first appears. Fewer children means parents invest more in each child. Education becomes a heavy condition. The underlying assumption that children will automatically become old age security for parents also begins to weaken.
The first week remains a matter of concern
The fourth number is about survival. Here India has made real progress.Infant mortality rate to decline from 39 deaths per 1,000 live births in 2014 to 24 in 2024. Infant mortality rate, or IMR, means the number of deaths of children under one year of age per 1,000 live births. Rural infant mortality rate fell from 43 to 27. The urban infant mortality rate fell from 26 to 17. The mortality rate for children under five fell from 45 to 28. The under-five mortality rate, or U5MR, means deaths before the age of five per 1,000 live births. These are not mere statistics. They mean that children who once would have died are now alive.But the first week is the most worrying part.
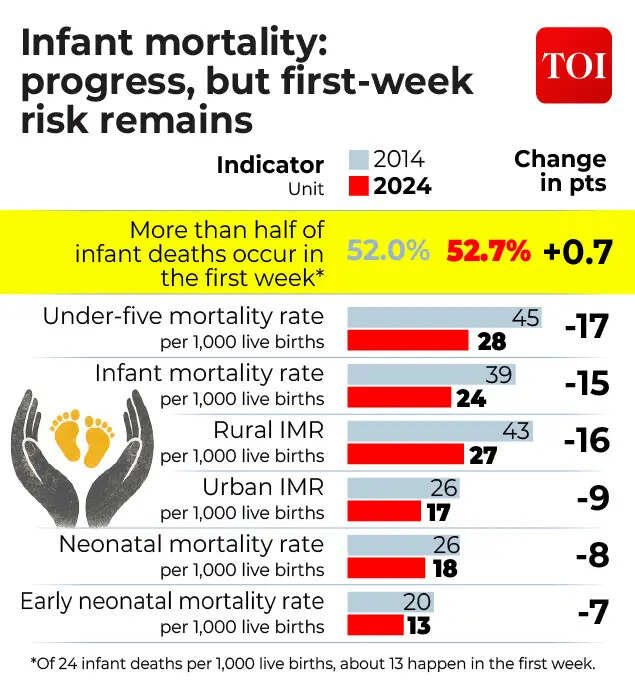
In 2014, 52% of infants died in the first week. In 2024 it was 52.7%. This means that, of the infants who die before turning one year old, more than half die in the first week. Infant mortality rates have declined in India, but those deaths that do occur still occur near birth. World Health Organization It is said that the first month of life is the most sensitive period for a child’s survival. UNICEF describes the first 28 days, known as the neonatal period, as the most vulnerable time for a child’s survival. India’s data fits that global warning.
Hospitals see births, miss deaths
Number five is the most frightening. It’s about how many deaths went unnoticed. At birth, the system is now in place. In 2014, 78.5% of live births received delivery care in government or private hospitals. By 2024 this will increase to 95.4%. Delivery in government hospitals increased from 52% to 71.7%.At the time of death, the system is much less visible. In 2014, 42.6% of deaths had medical assistance sought in government or private hospitals before death. In 2024 this figure was 40.2%. The category of “untrained workers, no medical care and others” increased from 22.4% to 45.5%.Now the chance of a baby being born under hospital care is much higher than that of a person dying under hospital care. WHO’s civil-registration framework states that information on births, deaths, and causes of death is central to public-health planning. If death occurs outside of formal care, the system may forget not only the person but also the cause.As India moves into its next phase of growth as one of the world’s largest economies, many issues will require high-level attention. The SRS, like all good data, is merely a reflection. What India wants to see in this will decide what happens next.